

Layout and Design
The Visual – This refers to the colors, graphics, and icons used in designing the infographic.
The Content – This includes the text, statistics, time frames, and references.
The Knowledge – This refers to the facts and conclusions to convey the overall message.
Criteria and Constraints
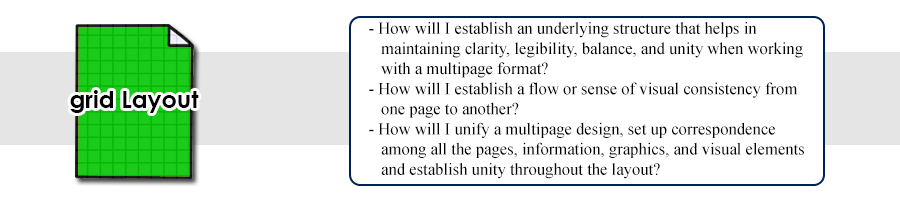
Infographic Layout
Vertical Canvas Size: 1100px Wide and 1700px Tall
Horizontal Canvas Size: 1700px Wide and 1100px Tall
Horizontal Canvas Size: 1700px Wide and 1100px Tall
Infographic Content:
- Visually compare and contrast 2 or more things
or
- Visually explain something
- Visually compare and contrast 2 or more things
or
- Visually explain something
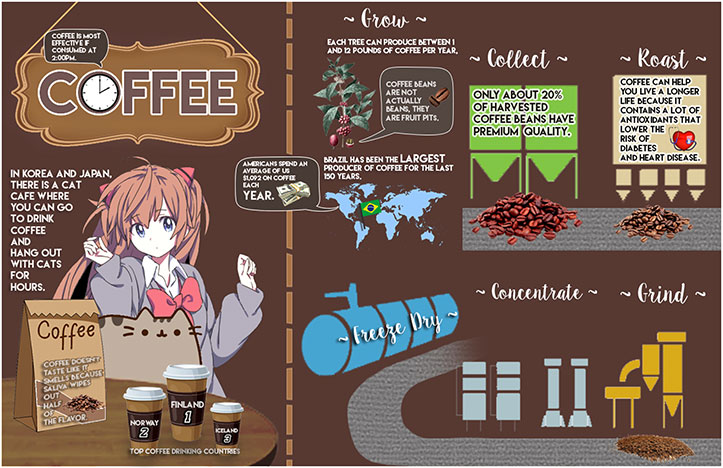
Any topic may be made into an Infographic and provide a meaningful message. (School Appropriate)
Include at least 10 facts
- Research using a variety of sources
- Illustrate Statistics
- Make it simple
- Research using a variety of sources
- Illustrate Statistics
- Make it simple
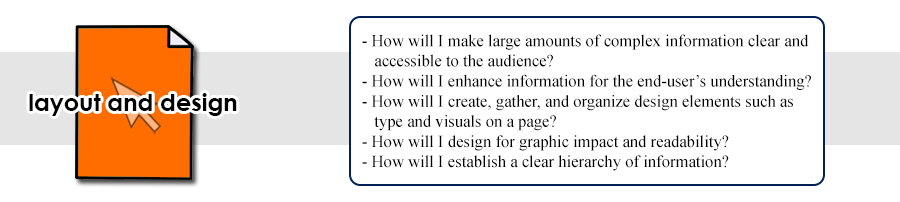
Infographic Design
Choose and create eye-catching graphics. People are attracted to visuals more than the text.
Use eye-friendly colors such as pastels and bright colors.
People love to view graphics more than just plain text. But with these two combined, you make information and learning more interesting and fun.
Selection of graphics, photographs, or visuals should support the concept.
Enable readability; clearly organize all information for the reader.
The goal is to clearly communicate, make information easily accessible, and clarify and enhance any type of information for the end-user’s understanding.